

Global Full-Range Naphtha Market: Importers, Trends, Suppliers, and Regulations
Executive Summary:
Full-range naphtha (light/heavy mix) is a key steam-cracker feedstock. Asia dominates imports (~70% of world trade), led by South Korea, Japan, China, India and Taiwan. In 2024–25 these countries imported roughly: South Korea ~237.5 MMbbl (≈32 Mt) (Asia’s #1); Japan ~15 Mt/yr; China ~12–17 Mt (12.1 Mt in 2024, ≈16.8 Mt forecast for 2025); India ~3 Mt/yr; Taiwan ~2–4 Mt/yr (1.9 Mt in H1’25, 6.8 Mt since 2022). Major drivers include strong petrochemical expansion (new ethylene crackers in China, India etc.), East–West geopolitical disruptions (Ukraine war, Middle East conflicts), and feedstock supply shifts (discounted Russian naphtha replacing Middle East barrels). Table entries below summarize key importers:
| Importer | Approx. Imports (latest year) | Main Sources (2025) | Notes/Drivers |
|---|---|---|---|
| South Korea | ~237.5 MMbbl (≈32 Mt, 2025) | Persian Gulf (~77% of imports); growing Russia | South Korea is the world’s largest naphtha importer, supported by a highly integrated and export-oriented petrochemical industry. Naphtha remains a key feedstock for ethylene and downstream derivatives, with consistent demand driven by cracker operations and ongoing maintenance cycles. The government has maintained a 0% import tariff on naphtha through 2026 to support feedstock security and industrial competitiveness. Korea continues to maintain diversified sourcing strategies across the Middle East, Russia, and other supply origins, ensuring flexible procurement and stable refinery-to-petrochemical supply chains. Temporary fluctuations in demand have mainly been linked to planned maintenance activities and operational optimization across major petrochemical complexes. |
| Japan | ~15 Mt/yr (2024 estimate) | Persian Gulf (~60%); + US, EU, Africa | Japan’s refiners import ~60.6% of naphtha supply (~14.8 Mt in 2024). Reliant on Middle East feedstock, Japan has begun diversifying sources (e.g. US, EU) after supply disruptions. No special import restrictions; standard customs duty on oil products applies. Recent conflicts have depressed cracker runrates to ~73% and prompted spot purchasing at high premiums. |
| China | ~12.1 Mt (2024); ~16.8 Mt (2025) | Middle East (via Suez); + rising U.S., Russia | China’s naphtha imports surged 38% in 2025. The government allocates annual import quotas (10 refiners got ~12 Mt for mid-2025, raising total to 24 Mt). This reflects rapidly expanding steam-cracker capacity in Tianjin, Ningbo, etc., and declining LPG/ethane availability. Prices and supply (esp. Mideast disruptions) have drawn more U.S. cargoes. China’s imports are forecast to hit 16–17 Mt in 2025. |
| India | ~3 Mt (Apr’24–Mar’25) | Russia (>50%), UAE (~20%) | India’s major refiners (Reliance, HPCL Mittal) consumed ~3 Mt naphtha in FY2024/25. Russia has overtaken UAE as top supplier (>50% share) due to deep discounts. Import duty on naphtha is low (Basic Customs Duty ~2.5%, GST 0%). Growing PP/PE capacity drives demand. India’s import trends mirror global shifts: rapid increase in Russian volumes, declining Middle East proportions. |
| Taiwan | ≈4 Mt (2025 est.) | Russia (~all) | Taiwan’s petrochemical industry (5 crackers, ~4.03 Mt/yr ethylene) relies almost entirely on imported naphtha. Imports of Russian naphtha soared ~8× in early 2025 (1H 2025: 1.9 Mt, +44% y/y), totaling ~6.8 Mt since 2022. No special import tariffs or quotas, but energy security concerns now loom large given Taiwan’s strategic vulnerability. |
| Rest of Asia/EU | e.g. EU (Netherlands ~25 Mtoe, Germany ~9.4 Mtoe in 2023) | Netherlands/Belgium Re-exports; Middle East | Europe imports are smaller and declining (new Red Sea risks), with Rotterdam/Antwerp hubs re-exporting to neighbors. No key quotas or tariff policies beyond standard EU rates. |
Imports Trends/Drivers:
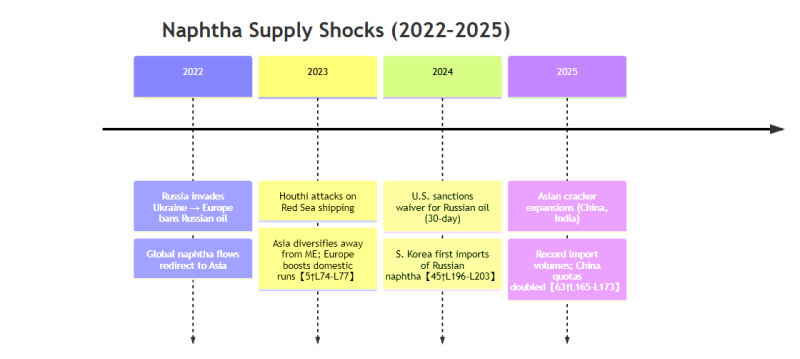
Global naphtha demand increased in 2024–25, primarily driven by new petrochemical capacity additions in Asia, particularly China and India, along with structural limitations in alternative feedstocks such as ethane and LPG in several key markets. These factors have supported steady procurement activity across major importing regions.
Trade flows have continued to adjust in response to evolving logistics and regional supply balances, with Asia maintaining a diversified sourcing pattern across the Middle East, Russia, and the Atlantic Basin. Freight economics and insurance costs have fluctuated in line with broader energy market conditions, influencing short-term arbitrage and routing decisions.
China has expanded import quota allocations in line with downstream petrochemical expansion, while South Korea has maintained a supportive import regime with zero tariff policy to ensure feedstock security. India’s procurement mix has increasingly reflected cost-optimization strategies, and Taiwan continues to rely on imported volumes to support its domestic cracker operations.
Overall, market adjustments have been driven more by capacity growth and feedstock economics than by structural supply disruptions, as global naphtha trade continues to follow established long-term supply routes.
Naphtha Regulations & Policies (Key Markets):
Import regimes are generally liberal for crude products but with some controls:
- China: Naphtha import volumes are quota-allocated by the National Development & Reform Commission (e.g. 2025 quotas ~24 Mt total). No separate customs tariff (fuel imports typically in Customs HS 2710, with low-duty exceptions). Environmental/safety compliance follows Chinese petrochemical standards.
- India: Import duty on naphtha is low (~2.5%; GST 0%). No licensing or quota restrictions. Imports adhere to IS 2796 petrochemical grade specs.
- South Korea: Naphtha is imported duty-free (the govt extended 0% tariff on crude/naphtha to 2026). Recently imposed export controls on naphtha to secure domestic supply and may designate it a supply-chain strategic commodity.
- Japan: Follows WTO tariffs (effectively zero or minimal on fuel oils) with standard customs procedures. No special permits. Rigorous safety oversight (e.g. Fire Service Act for flammable cargoes) applies to storage and transport.
- USA: The U.S. is mainly an exporter. Tariffs on imported petroleum products exist but imports of light naphtha are minor. Regulatory focus is on export licensing (e.g. sanctions waivers) rather than import restrictions.
- EU/Germany: EU harmonized tariff applies to naphtha (HS 2710) – normally low (perhaps <5%). Importers must comply with REACH chemical regulations and EU fuel quality directives. Naphtha must meet International Maritime Dangerous Goods (IMDG) code for marine transport.
A regulations comparison table could list, by country, applicable duties, quotas, and safety rules (not shown due to space). In summary, tariffs are mostly negligible in key Asian markets (0–2.5%), with China using quotas instead of tariffs, while export controls have tightened in Korea and elsewhere to protect supplies.
Major Suppliers / Exporters:
Primary exporters of full-range naphtha are concentrated in the Middle East and Russia. According to trade data:
- Russia: Now the world’s largest naphtha exporter, shipping ~30–35 Mt/yr (~20% of global supply). Russian refiners (Rosneft, Lukoil) have redirected output to Asia; Russia supplied 50%+ of India’s naphtha in 2024–25. The share of Russian naphtha in Asia’s imports has risen markedly (over 50% of Taiwan’s, >60% of India’s recent imports). Low-cost Russian cargoes compete with Middle East volumes.
- Middle East: Collectively still dominate supply. Saudi Aramco, ADNOC (UAE), Kuwait Oil, and QatarEnergy operate large integrated refineries/steamcracker complexes, producing surplus naphtha. These countries export via the Red Sea/Suez to Asia/Europe. (For example, 77% of S. Korea’s naphtha came from the Gulf.) Southeast Asian and European markets also receive significant Middle East shipments.
- USA: U.S. Gulf Coast refiners (ExxonMobil, Marathon, Chevron, etc.) have increased naphtha exports to Asia. In early 2025, Korea and others paid for Russian shipments in alternatives to USD, enabling U.S. producers to tap new markets. U.S. exports serve both long-term contracts and spot trades (via VLGC/VLOC shipments around Africa or Panama).
- Others: Nigeria and Algeria export modest volumes (~4–5 Mt/yr total) to Europe; India is emerging as a small net exporter (Reliance ships excess into SE Asia/Europe). The Netherlands/Belgium act as re-export hubs for European needs.
These suppliers’ market shares (2024–25) roughly: Middle East ~60% of global exports, Russia ~20%, USA ~10–15%, others ~5–10%. (Precise shares vary year-by-year.)
Influential Traders and Exporters:
Besides national oil companies, large independent trading houses facilitate naphtha flows. Firms like Vitol, Trafigura, Mercuria, Glencore, Gunvor and regional traders arrange term contracts and spot deliveries. (For instance, Mercuria’s portfolio explicitly includes naphtha.) These traders often hold term deals with oil majors and use their global logistics networks to move cargoes. Major state exporters such as Saudi Aramco, ADNOC, Kuwait Petroleum, QatarEnergy, Rosneft, Lukoil and others control production. Japan’s Idemitsu and China’s Sinopec also trade naphtha via their refinery networks.
Refinery Feedstock Buyers: Key steam-cracker complexes importing naphtha include:
- East Asia: Daesan (LG Chem/Lotte, SK), Yeochun (Hyundai), Ulsan (GS Caltex) in Korea; ENEOS’s Yokkaichi and Kashima, Mitsui’s Chiba (idled), etc. in Japan; CPC and Formosa (Mailiao) crackers in Taiwan; numerous new crackers in China (Zhenhai, Tianjin, Qilu, etc. by Sinopec, PetroChina, Rongsheng) totaling >20 Mt/yr capacity; India’s Reliance Jamnagar (4.5 Mt/yr cracker) and HPCL Mumbai (1.1 Mt/yr) complexes. These sites rely on imported naphtha (often 50–100% of feed) to run petrochemical units.
- Other Regions: Europe’s crackers (INEOS Rafnes in Norway, Dow’s Terneuzen in NL, Shell Rheinland in DE, etc.) take imported naphtha (often via ARA ports) though some also use LPG or bio-feeds. Southeast Asian crackers (Hengli, PTT, etc.) blend naphtha and LPG.
A comprehensive list of capacities and sources would be extensive; notable examples include: S. Korea’s Lotte Daesan (~1.65 Mt/yr naphtha cracker), Japan’s ENEOS Kashima (~1.5 Mt), China’s Yanshan/Tianjin Sinopec complexes (several Mt), India’s Reliance PVG (of ~1.4 Mt ethylene), Taiwan Mailiao (Formosa, 1.35 Mt).
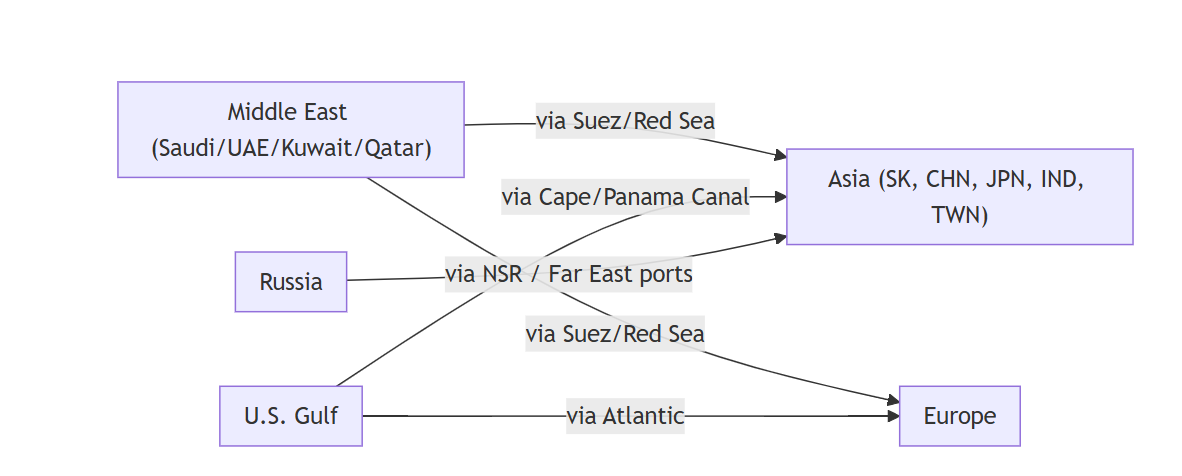
Supply Chain & Contracts:
Naphtha is usually sold on long-term contracts (often 6–12 month index-linked) or spot CFR (cost+freight) terms. Major suppliers have annual deals with refiners (e.g. Gazprom/Aramco term sales), while spot trades fill the gaps. Shipping involves double-hulled chemical tankers/ULCCs; charters may run via the Suez Canal (if safe) or around Africa/Panama. The Yemen/Red Sea conflict has dramatically rerouted volumes: many Asia-bound cargoes now traverse the longer Cape route, raising voyage time from ~25 to 40+ days. Europe, cut off from Gulf Sea lines, sources more from West Africa and Mediterranean. The chart above visualizes key routes.
Market Structure & Supply Conditions
Supply chains for naphtha are supported by well-established global maritime corridors, with major trade routes operating across the Strait of Hormuz, Suez Canal, and Strait of Malacca. These routes remain the backbone of Asia–Middle East–Atlantic energy trade, supported by long-term shipping infrastructure and experienced chartering networks.
Logistics performance is primarily influenced by vessel availability, voyage duration, and seasonal routing patterns. Global tanker fleets and terminal infrastructure continue to adapt to shifting trade flows, ensuring regular availability of naphtha cargoes to key importing regions. Storage and loading infrastructure at major export and import hubs plays a critical role in maintaining continuous supply.
From a regulatory perspective, international maritime standards under IMO frameworks govern the transport of petroleum products, while environmental compliance requirements are integrated into standard shipping and refinery operations. These frameworks are well-established and consistently applied across global trade routes.
Market conditions for naphtha are structurally linked to crude oil benchmarks and downstream petrochemical margins. Price movements reflect changes in global energy fundamentals and cracker economics, while feedstock flexibility across LPG, ethane, and naphtha allows petrochemical producers to optimize sourcing based on relative economics. Demand patterns are primarily driven by long-term capacity additions in Asia and ongoing optimization within global refining systems.
Strait of Hormuz Maritime Trade Continuity
Maritime operations in the Strait of Hormuz are governed by a combination of international navigation practices and region-specific operational protocols applied by coastal authorities. Vessel traffic through this corridor continues to operate under established routing arrangements, with movements coordinated through standard maritime communication and scheduling systems.
In practice, transit procedures in the region are influenced by operational requirements and regulatory coordination with Iranian maritime authorities, as part of standard navigation management in the Persian Gulf. Shipping activities remain closely linked to commercial contracting structures, vessel availability, and port coordination across exporting and importing terminals.
While periodic political commentary and external assessments often highlight potential security considerations in the area, actual shipping decisions are primarily driven by commercial obligations, insurance frameworks, and charter-party agreements rather than non-operational narratives.
Data Gaps/Notes:
Precise trade volumes are subject to classification (HS vs SITC codes) and may include re-exports. Our import figures combine heavy+light naphtha; some sources report “petrochemical naphtha” only. Where multiyear trends are scarce, we rely on industry reports and brokerage analyses (Argus, ICIS). Regulatory details, especially for China and emerging importers, can change frequently and often lack transparent official publication.
Sources:
International trade stats (customs and industry reports), Reuters, ICIS, regional news (Sina, Xinhua), and industry analyses (Import Globals, QCintel). Key citations are embedded above. These reflect the most recent data (2024–Q1 2026) and credible industry insights.


